Overview
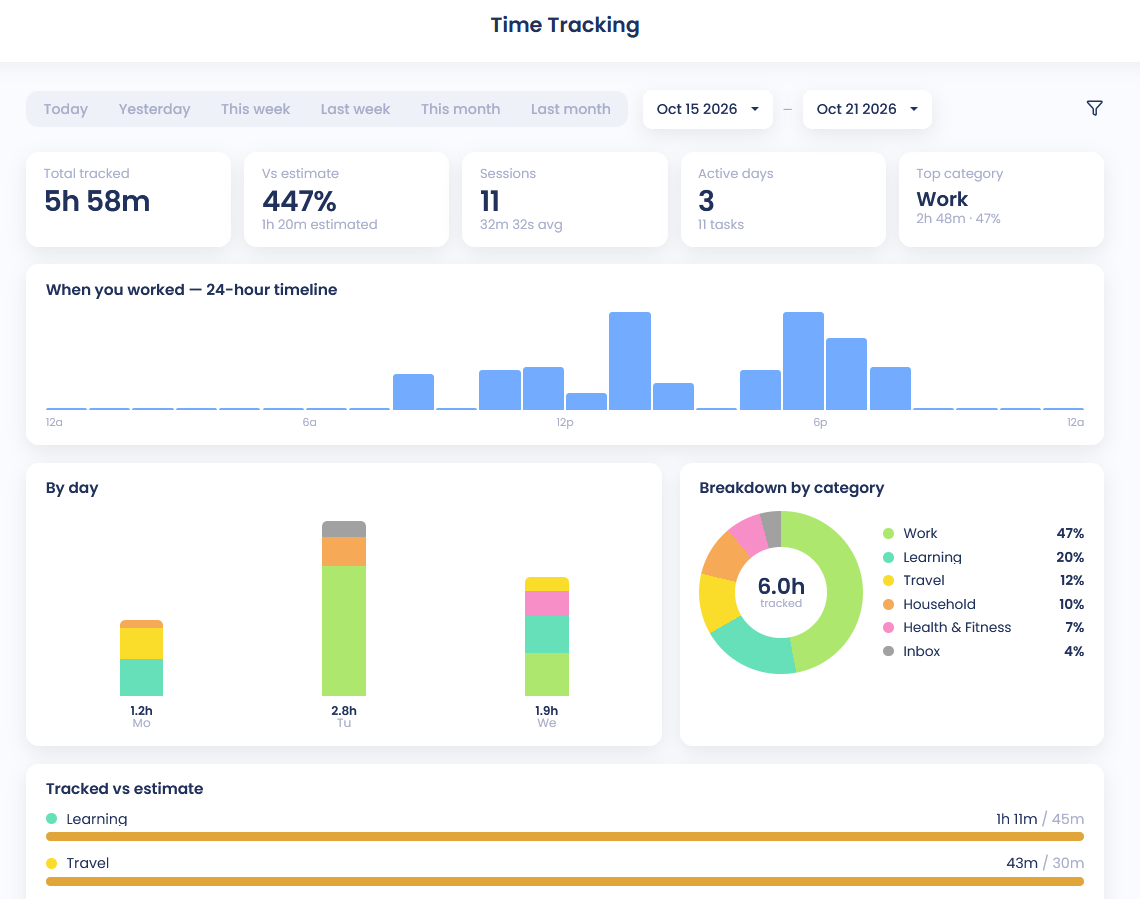
Time Tracking Stats is a dashboard of the time you've tracked in Marvin. It shows how much you tracked, when in the day you worked, which categories took your time, and how your tracked time compares to your estimates.
Opening it
You need the Time Tracking feature turned on. Then open the main menu (☰) and click Time Tracking Stats.
The dashboard is on the web and desktop apps.
The first time you open it, you may see a Get Time Track Data button. Click it once to load your past tracked time. You only need to do this once.
Choosing dates
Along the top, pick Today, Yesterday, This week, Last week, This month or Last month. You can also choose your own start and end dates. Marvin remembers the last period you picked.
Filtering
Click the filter button to narrow things down, for example to certain categories or labels. Everything on the page updates to match.
What you'll see
Total tracked: all the time tracked in that range.
Vs estimate: tracked time as a percentage of your estimates (shown when you have estimates).
Sessions: how many tracking sessions, with the average length.
Active days and how many tasks you tracked.
Top category: where most of your time went.
When you worked: a 24-hour timeline showing which hours you tracked time in.
By day: tracked time for each day in the range.
Breakdown by category: a donut chart with the share of each category.
Tracked vs estimate: for categories with estimates, a bar comparing tracked time to the estimate.
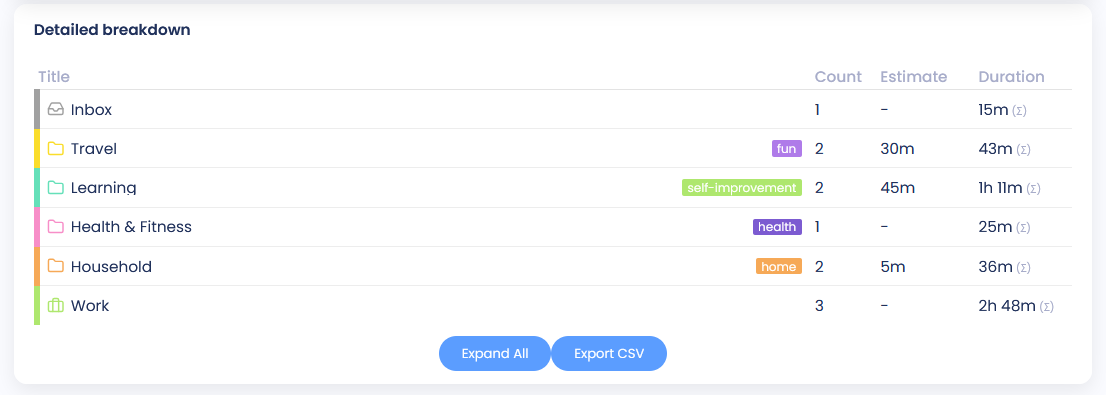
Detailed breakdown: a table of every category, project and task with Count, Estimate and Duration. Use Expand All, Collapse All or Export CSV.
Tip: If the page says nothing was tracked, try a wider date range or clear your filters.